‘Coronavirus maps’ support the fight against infection, say researchers
 Source: Military University of Technology
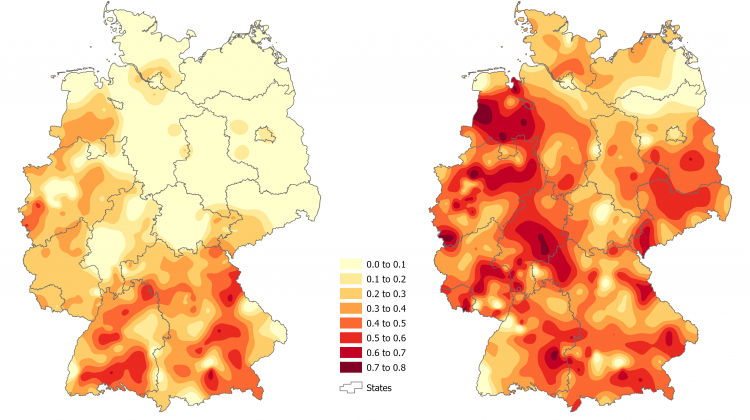
Researchers from the Military University of Technology have developed maps detailing the distribution of Covid-19 infections in Germany.
According to the scientists, the maps can help characterize the occurrence of the coronavirus pandemic, determine the zones with the greatest risk of infection, and identify the areas in which the most intensive measures should be taken.
Dr. Albina Mościcka from the Faculty of Civil Engineering and Geodesy of the Military University of Technology said: “The example of Germany shows that even countries that are considered quite good at handling the pandemic find it difficult to fight such an insidious enemy as the SARS-CoV-2 virus.”
Summarizing the results of her research in an article published in the Journal of Clinical Medicine, the scientists which include Dr. Andrzej Araszkiewicz, Dr. Marta Kuźma and PhD students Jakub Wabiński and Damian Kiliszek, the scientists analysed the spatial structure differentiation and spatial concentration of infected people.
The phenomena were studied during two waves of infection in Germany: in spring and autumn 2020. Germany was selected for the study due to the large number of tests performed in the country and the availability of detailed data on infections provided by the Koch Institute in Berlin.
Dr. Mościcka said: “The research results show that while in the initial stage of the pandemic (spring) there were single outbreaks of infections, in the fall the infections covered the entire country. This means that in the summer, when the virus seemed to retreat, it was in fact quietly spreading throughout the country. This proves how insidious it is and it is a valuable hint to remain vigilant even when the infection statistics are very optimistic.”
The researchers have now shown that spatial-temporal analysis of the pandemic using limited infection data can be useful for a quick and preliminary assessment of the spread of infection.
The cartographic method used involves maps to analyse and understand the phenomena, discover new regularities in their distribution and interdependence, and forecast changes.
Dr. Mościcka said: “The map shows the spatial relations between the phenomena presented in a direct way, that is, exactly as they exist in reality. Map research is used, for example, in environmental protection, logistics, crisis management, transport, archaeology, cultural heritage.”
She added that the essence of the cartographic research method is the inclusion of methods from various sciences: statistics, mathematics, physics. This enables multi-directional and multi-parameter transformation of data presented on maps, and consequently extracting completely new information.
In spatial analysis, the researchers used the potential model, entropy, the centrographic method and the Lorenz curve. The model allowed them to identify core regions with a high level of development of new infections along with areas of their impact, and regions with a low level of generation of new infections. Entropy showed a spatial distribution of differentiation in the infected area and the change in these characteristics between spring and autumn. The concentration method allowed for the spatial and numerical demonstration of the concentration of the infected population in a given area.
Cartographic methods can be widely used for studying the distribution of infections during the COVID-19 pandemic. They are used for analyses related to infectious diseases and other rapidly spreading phenomena. They support the related crisis management. They can also be used to analyse unemployment or education. Cartographic methods help to identify areas with similar economic (e.g. income level), environmental (e.g. air pollution) and social (e.g. public health) characteristics. Knowledge of these areas allows to take appropriate measures for sustainable development of the country.
Source article: 'Modeling of Various Spatial Patterns of SARS-CoV-2: The Case of Germany' can be accessed here: https://www.mdpi.com/2077-0383/10/7/1409
PAP - Science in Poland
kol/ ekr/ kap/
tr. RL
Przed dodaniem komentarza prosimy o zapoznanie z Regulaminem forum serwisu Nauka w Polsce.